
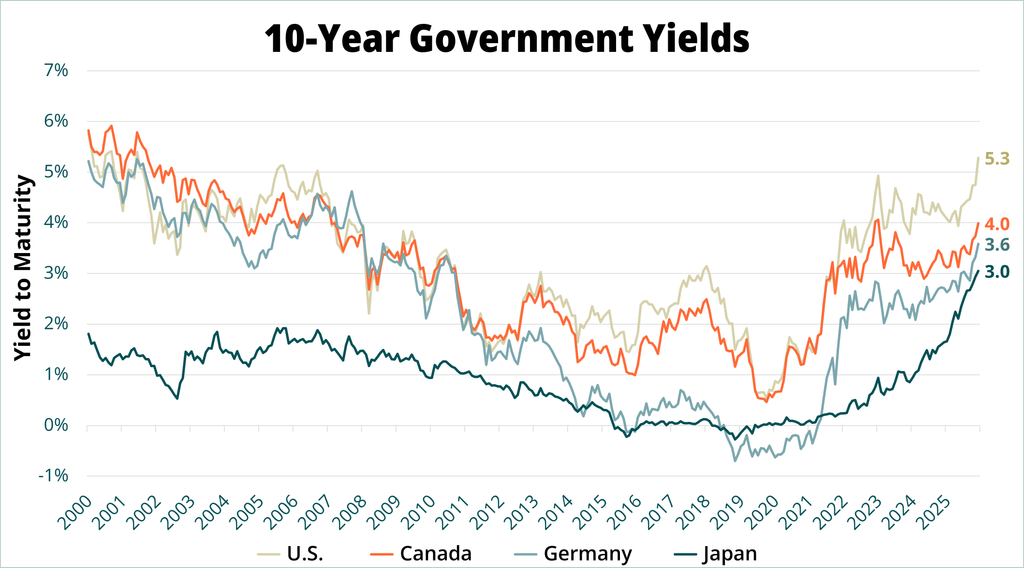
For most of the past fifteen years, debt was close to free. This conditioned a generation of investors to believe that very low interest rates were the natural order. Historically, this hasn’t been the case. The past few months have been a sober reminder of how quickly conditions can change. Since the pandemic, the cost of money has reversed sharply, with the 10-year U.S. Treasury yield (UST10Y) recently touching 5.3%, its highest level since 2002. Similarly, the 10-year Canadian government bond yield has risen to 4.0%, slightly below its recent high in 2023 and edging closer to 2007 levels. As shown below, both the German 10-year and Japanese 10-year yields followed suit, rising to levels not seen in over a decade. Global central banks have resumed a path of monetary tightening, and with the U.S. Federal Reserve (Fed), the European Central Bank, and the Bank of Japan all raising policy rates, the repricing in long bonds has accelerated. All three central banks cited the ongoing energy price shock arising from the Middle East conflict as a reason.
Source: Bloomberg, QV Investors Inc.
Central bank policy decisions typically look through such commodity-related supply shocks as transitory, so it is unusual for them to react this way. The current concern is whether this supply shortage persists longer, potentially spilling into broader inflation and de-anchoring long-term inflation expectations. This remains to be seen as market-implied inflation rates have been well behaved even during this bond sell-off. Confidence in price stability among investors and consumers is wearing thin, however, especially after enduring six years of above-target inflation. We are likely to see further policy rate hikes to come as central banks take proactive measures to contain inflationary risks.
To understand why yields rose even though inflation expectations stayed put, it helps to split a bond’s yield into two parts: the real yield that investors receive plus inflation expectations. If a bond pays 5.3% and inflation is expected to run at around 2.3%, the ‘real’ yield is roughly 3.0%. That is what investors earn after inflation. While market-implied inflation remains anchored, real yields have been the principal force lifting nominal yields higher in the quarter. This suggests the yield sell-off has been driven by factors other than inflation concerns, such as higher policy rates, increased treasury bond supply and, crucially, a lack of trust in fiscal discipline.
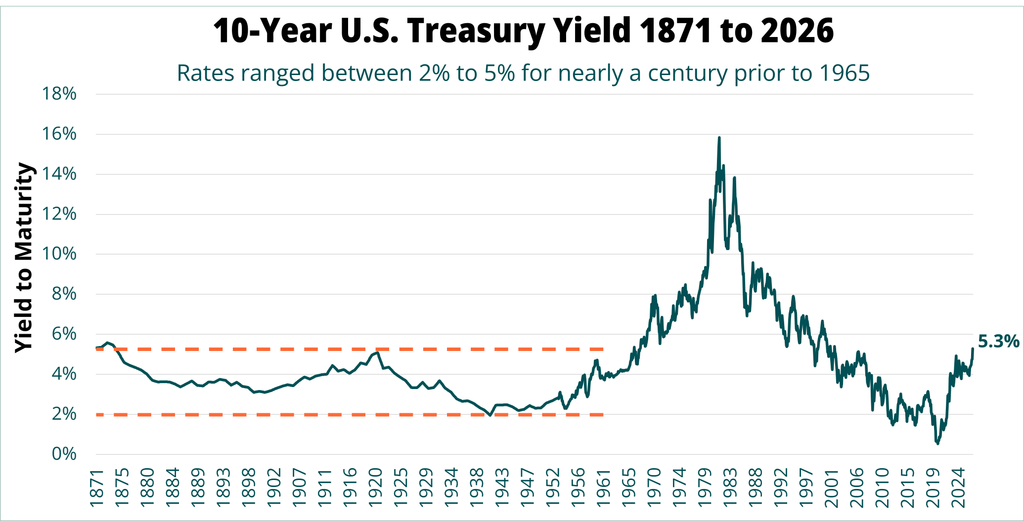
The recent yield sell-off has been a swift sting for investors. The 5.3% yield on the UST10Y as of the end of September far exceeds the 1.0% trough back in 2020. Relative to the last 15 years, yields today may appear extreme. However, widening our time horizon as far back as 1871 reveals another story, with the UST10Y trading in a range between 2% and 5% for nearly a century prior to 1965. This long historical period included wide swings in inflation arising from two World Wars as well as the deflationary period of the 1930s. The era of great inflation followed with a painful 16-year climb to a peak in 1981, which subsequently gave birth to a four decade long bond bull market of falling rates before ending with the global pandemic in 2020. Since then, yields have sharply reverted to the mean as they have rebounded from ZIRP (zero-interest rate policy) era levels in the 2010s.
Today’s yields feel extreme to many, yet the long-term record suggest near-zero rates were the aberration. The spike of the 1970s and early 1980s, followed by decades of falling rates, warped our sense of what is normal, and most investors formed their expectations in that unusual stretch. With quantitative easing now behind us, today’s rates look less like an anomaly and more like a return to where rates spent much of the past 150 years. For bond investors, that means earning a decent return after inflation again, something that was hard to come by for a long time.
Source: Robert J Shiller, Bloomberg, QV Investors Inc.
Well, It Depends
If the price of money is the gravitational force that every other asset is judged against, will a higher discount rate result in lower asset prices? In the real economy, there is growing evidence of slowing U.S. housing activity, with 30-year mortgage rates reaching 7.3%. Mechanically, it makes sense to assume that a higher discount rate would lead to lower equity valuations. When interest rates rise, bonds become more attractive relative to stocks, so investors pay less for every dollar of company earnings, pushing stock valuations lower.
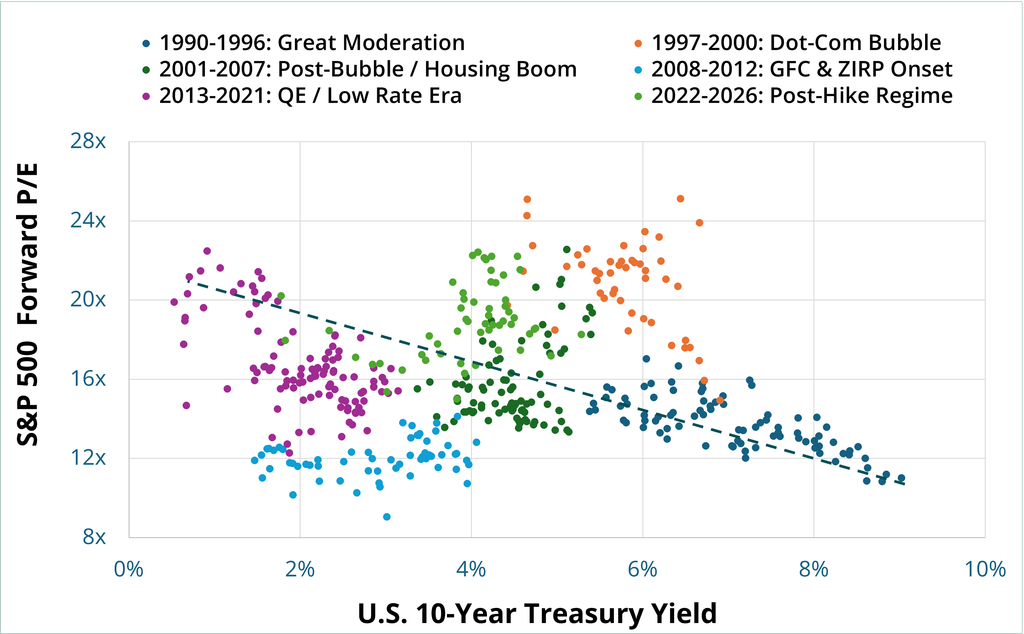
Consider the relationship between the S&P 500 forward price-to-earnings (P/E) multiple (y-axis) and the UST10Y yield (x-axis). The empirical scatter plot (below) shows different coloured regimes dating back to 1990, as the historical context within each period is worth highlighting.
The tightest cluster in the dataset, between 1990 and 1996, shows a time (the Great Moderation) when the P/E multiple steadily expanded as the UST10Y fell each year. Then, from 1997 to 2000, the irrational exuberance of the dot-com bubble drove equity multiples to extreme highs, even as 10-year Treasuries traded in the 5% to 7% range. This was the first major break in the relationship between interest rates and equity valuations. Between 2001 and 2007, the P/E multiple steadily compressed as the dot-com bubble deflated and yields hovered lower around 4% to 5%. This was followed by the Great Financial Crisis from 2008 to 2012, as stock valuations fell sharply alongside yields as extreme accommodative monetary policies (QE) were introduced. From 2013 to 2021, depressed interest rates followed the predicted relationship as the TINA (There Is No Alternative) narrative justified higher equity multiples in an era of extremely low rates. Which brings us to the post-hike regime from 2022 to 2026. As mentioned, the UST10Y has risen sharply to over 5% today, yet the forward P/E has stubbornly remained at 19x-22x, well above the 14x-16x range that prevailed at similar yield levels in the past.
Source: Bloomberg, QV Investors Inc.
Theoretically, the relationship between yields and multiples should produce a downward-sloping line of best fit. But the historical data does not support this supposition, with the correlation appearing weak across time. Market, economic and political context matters, as some periods demonstrated a strong relationship, while others did not, suggesting other considerations may have taken precedence. Markets are not mechanical, as many factors contribute to valuation dynamics. For example, human emotions like greed (the dot-com bubble) and fear (the global pandemic) can outweigh other factors and dominate market prices. Higher bond yields rarely pull stock valuations lower in lockstep. Instead, interest rates act more as a gradual pressure rather than an immediate lever on stock valuations. They do however shrink an investor’s margin for error, and that risk is greatest when earnings growth slows.
Earnings Have Been King
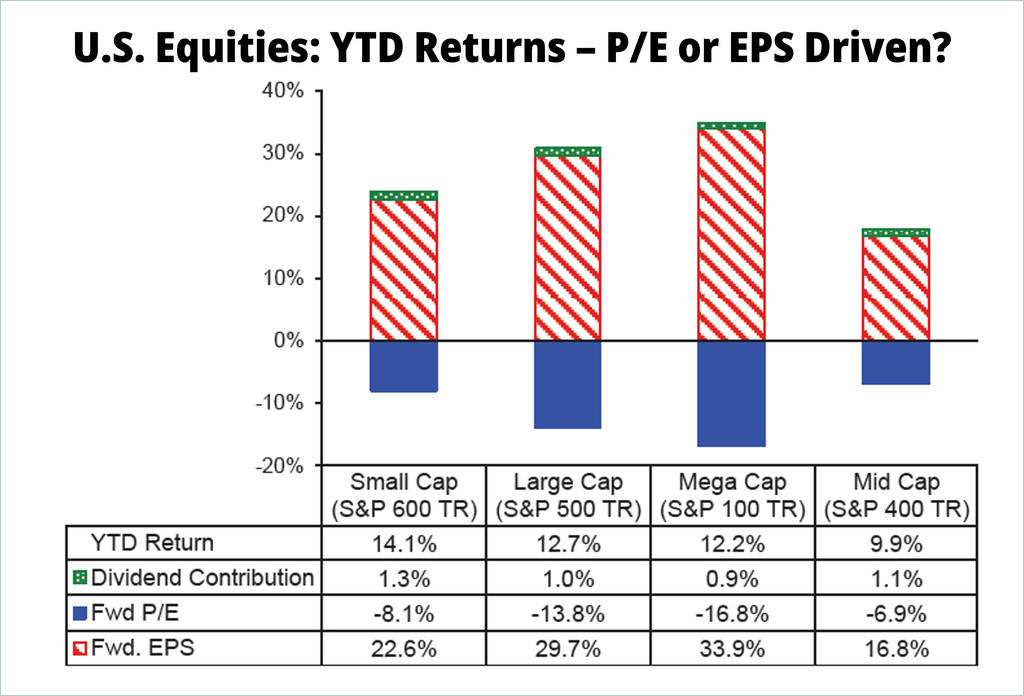
Stock markets have been robust, climbing the wall of worry and demonstrating resiliency in the face of tariffs, the Middle East conflict, and rising interest rates. Year-to-date, it has been earnings growth, rather than multiple expansion, that has been carrying equities. S&P 500 earnings per share (EPS) has grown at an unprecedented clip of 29.7% YTD. This is an exceptional rate of growth outside of post-recession earnings recoveries, especially because it was achieved off a record 2025 earnings base. The TSX Composite also grew EPS at a respectable 17.8% YTD. Corporate earnings continue to surprise to the upside. Fears that higher yields may lead to valuation headwinds have been proven wrong as robust earnings have backfilled those concerns. In fact, the S&P 500 forward P/E has declined from 22x at the beginning of the year to 19x at the end of September on strong earnings growth rather than price declines, a healthy dynamic.
Source: Scotiabank GBM Portfolio Strategy, Bloomberg
The persistency of this above-average earnings growth has been impressive. S&P 500 bottom-up consensus earnings forecasts are calling for a 17% year-over-year growth rate for both 2027 and 2028, slower than the current rate but still above the five-year average of 13.3%. A continuation at this pace could tame the most bearish of investors and normalize market valuations while avoiding a drawdown. However, this assumes the status quo remains undeterred, and while this may indeed be the case, a prudent investor remains skeptical and considerate of underlying growth assumptions embedded in forward-looking valuations. Should the weight of bond yields grow heavier, the persistency of earnings growth becomes increasingly important to sustaining market health and equity returns.
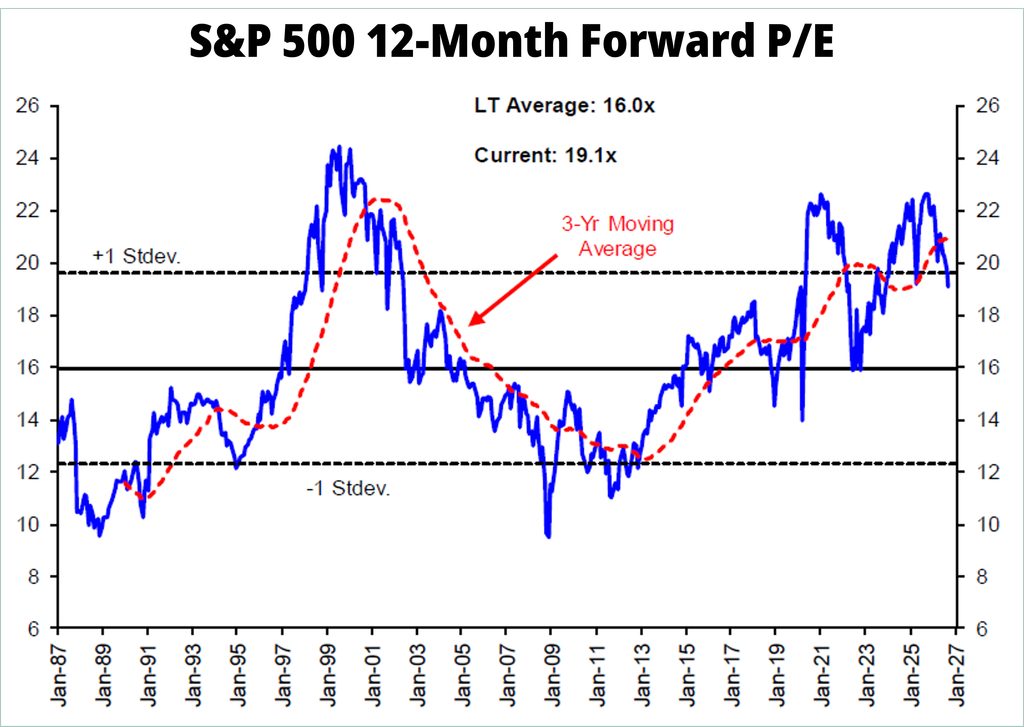
Source: Scotiabank GBM Portfolio Strategy, LSEG
Carney Goes Mega
For most of the past decade, Canada has invested less than the United States in non-residential assets as a percent of GDP (shown below). U.S. investment in data centers and AI infrastructure has kept growing, and at a pace that has exceeded even the most optimistic forecasts. Ottawa has been slow to respond to this divergence but has made some milestones recently. Less investment today results in slower productivity growth tomorrow, a main source of sustainable real wage gains. Should this disparity persist longer term, Canada risks falling further behind in relative living standards, as well as a weaker fiscal position due to an eroded tax base. Canada will naturally grow more dependent on U.S. demand, which runs counter to the diversification strategy that Prime Minister Carney is pursuing.
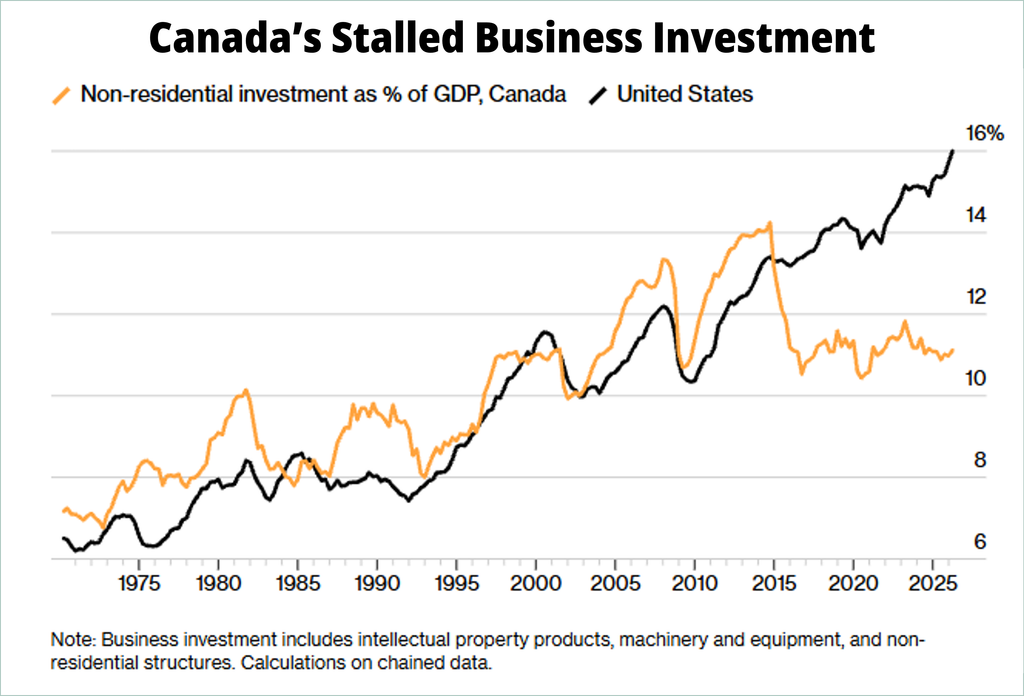
Source: Statistics Canada, Bloomberg
One of Carney’s goals set in his first budget was to catalyze over $1 trillion in total investment over five years. At the most recent Canada Investment Summit in September, Carney introduced a new “productivity mega deduction” that allows businesses to write off 100% of new capital investment across a broad set of assets, effectively halving the marginal effective tax rate on new investment to encourage greater activity. Final investment decisions on two major energy infrastructure projects were announced soon afterwards, the $33 billion LNG Canada Phase 2 project and the $35 to $44 billion Pacific Link West Coast oil pipeline. It is refreshing to see this investment traction and the hope is for this trend to continue.
However, as headlines roll in, it’s worth noting that pledged capital is not the same as invested capital. These are large projects with long lead times, and the economic benefit is still subject to execution risk and many other factors. Despite what seems to be a tailwind of opportunities, investors are reminded that government-led capital cycles create both winners and losers, and as investors, our job is to separate announcement hype from real cash flow. Here are some other practical insights we have found valuable:
- Strategic importance is not a guarantee of shareholder returns. Large projects often reward customers, governments and suppliers more than sponsors, and cost overruns are a common occurrence. Countries and investors have different mandates that may not always align.
- Return on capital matters more than capital deployed. Favour diversified businesses run by disciplined management teams that have a proven track record of economic value add.
- Resist paying for the story. Flashy narratives often re-rate market prices well before earnings come through. Insist on a margin of safety or wait for a better entry point.
- Humility itself is a strategy. Stay within your circle of competence. Keep to businesses that can earn profits on their own merit and be skeptical of those that rely on supportive policy.
Long-term investing is as much about risk management as it is about capital appreciation. Governments can pivot from their policies, leaving assets stranded. Consumers’ tastes can change, and booms can eventually bust.
We are trimming positions with valuations that depend on the persistence of a rosy outlook. Balance sheets are being stress tested, and the durability of earnings are being assessed. Risk management starts from the bottom up and our experience has taught us to enjoy the bull markets, but to keep on our toes as they do not last forever.
Our strategy teams continue to find new opportunities that are consistent with our holistic investment tests. We are avoiding excesses by staying disciplined to our risk-managed approach, helping to ensure that the rate of compounding within each of our strategies remains uninterrupted. We hope the good times endure but are prepared in case they do not.