

Written by the Fixed Income Team: Gennice Spanier and Clement Chiang
What you may be hearing about yields
Near the end of May, the U.S. 30-year treasury yield rose to over 5%, reaching a level that, prior to a brief period during 2023, had not been seen since 2007. This is not a phenomenon that is occurring in isolation, with many sovereign bond issuers in the UK, Japan, and Europe seeing their curves bear steepen (longer end of the yield curve rising further than the shorter end). There have been many headlines speculating the causes that are driving long bond yields higher, with much confusion among them. It can be hard to make sense of the noise. At times like these, when the market narrative is turbulent, we find it beneficial to take a step back and focus on the fundamentals.
Breaking down the yield curve
When analysing the fundamental drivers of erratic yield moves such as the ones we have experienced in the market, it can be helpful to break yields down into components to better understand where the volatility is stemming from.
Nominal bond yields are the sum of two key components: inflation expectations and real yield.
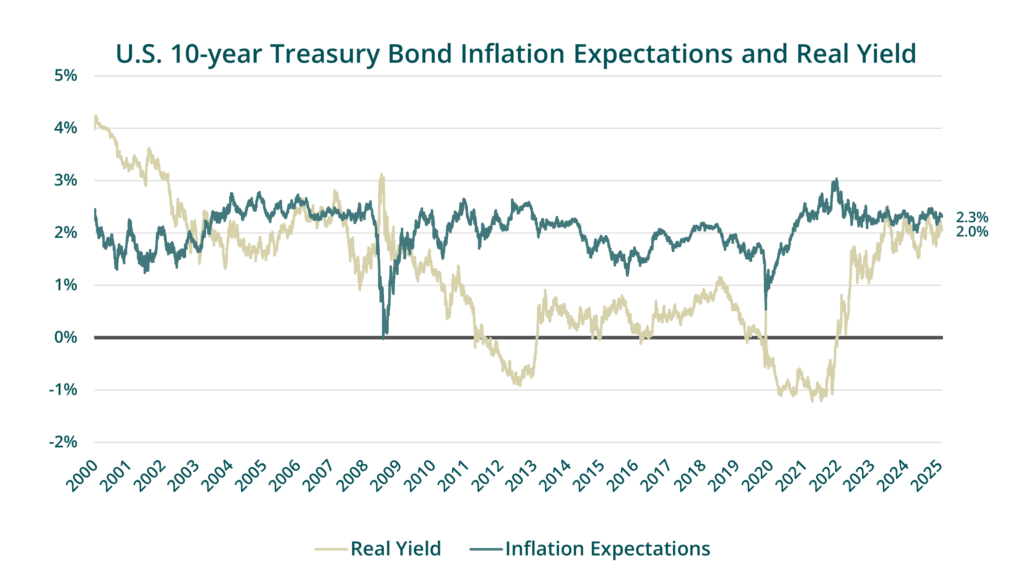
Source: Bloomberg, QV Investors
Inflation expectations are the rate of inflation that the market is pricing in. This can vary between tenors (times to maturity), as the market may price in differing inflation expectations for different time periods. The expected inflation priced into the 10-year U.S. treasury is currently 2.3% but, as shown in the chart above, has ranged between 0%-3% in the past 25 years. Inflation expectations tend to vary more in the shorter tenors but tends to remain close to 2% over the longer term. This is because the U.S. Federal Reserve (Fed) has an explicit mandate to target inflation between 1%-3%, anchoring the market’s expectation that inflation will trend between this range in the longer term.
Real yield is the second component, which is the real rate of return that bond investors expect to receive after accounting for inflation. It is derived by taking the nominal yield and subtracting expected inflation. The 10-year U.S. treasury real yield is currently 2.0%. We have seen more variation in real yield over time as this is more closely correlated with central bank monetary policy than inflation. Real yields for the 10-year U.S. treasury have ranged from below -1% to over 4%, also depicted in the above chart. During the 2010’s and into the beginning of the 2020’s, we saw very low levels of real yield. This was because the Fed was undertaking quantitative easing (QE) to stimulate the economy, which was accomplished by keeping the policy rate low, and as a result pushed real yields lower. We have seen a normalization in the real yield when the Fed shifted to quantitative tightening (QT) in 2022, as they began raising policy rates to manage heightened inflation.
However, there is an additional factor to consider when analyzing the yield curve and that is the term premium. The term premium is a subcomponent of real yield. It is an estimate of the additional yield required to compensate investors for the risks of lending over a longer set time period versus rolling over a series of short maturity bills.
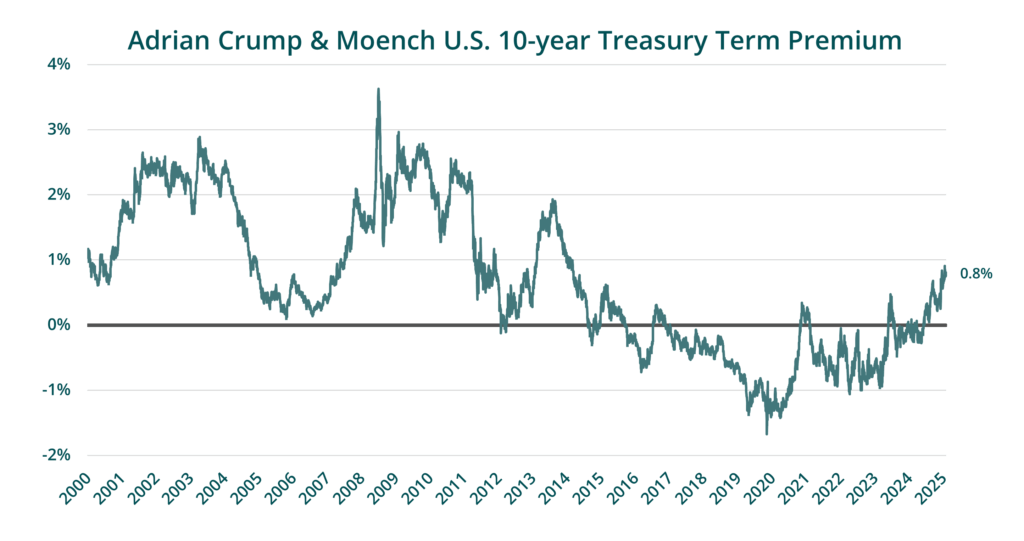
Source: Bloomberg, QV Investors
The term premium for the U.S. 10-year treasury has fluctuated between roughly -1.5% to 3.5% since 2000, remaining in negative territory for most of the last decade but returning to positive territory in the past year to 0.8% currently. The recent rise in the term premium could simply represent a normalization from the extreme low levels brought on by QE but could also be a result of higher government budget deficits, as well as greater market uncertainty. The return of the term premium marks a change in sentiment towards U.S. treasuries as its risk-free credit quality is questioned.
What is influencing yields?
We believe one of the leading forces behind the rise in long sovereign bonds has been concerns over unsustainable government debt levels driven by profligate fiscal deficits. Investors are increasingly demanding a higher risk premium to buy long maturity bonds because of elevated risks associated with higher debt levels and an increasingly uncertain outlook. The impact was most pronounced in the long end as yields repriced higher to better compensate investors from heightened perceived risk. This repricing was driven by an increase in the term premium, especially in long maturity bonds as the market demands a higher premium for lending longer term.
Yield volatility for the short end of the curve has been from changes in policy rate expectations. The market has been recalibrating its rate expectations after each new tariff announcement by considering what the resulting impact on inflation and economic growth would be in the near term. Inflation expectations are higher in the short end as investors expect inflation to remain elevated in the near term, prompting the Fed to hold policy rates at the restrictive 4.5% level to help lower inflation. We expect the market will continue integrating new information as it comes, leading to the push and pull dynamic of policy rate expectations and changes in term premiums across the maturity spectrum.
What is our take?
There are a lot of forces influencing yields as each new piece of information emerges. This is causing rate volatility as the market assesses a change in outlook and adjusts yields accordingly. Short-term volatility can be distracting and exhausting. Our approach is not to look past volatility, but to use it to our advantage and integrate the new information into our longer-term view of yield levels, rather than reacting to short-term impacts.
We can use our longer-term base expectations for the yield curve to inform our decisions to either over or underweight duration (price sensitivity to changes in yield) relative to the benchmark as we view appropriate. Our forecasts reflect our view of Canadian bond yields, which are likely to be heavily influenced by the U.S. bond market because of the integrated nature of our economies. Given that we perceive there to be mounting risks to the economic outlook in Canada, we continue to hold a slight overweight duration position relative to the benchmark. We believe the forces working against the economy are likely to push yields lower as the Bank of Canada lowers rates to provide monetary accommodation. We are aware that tariffs have introduced new risks and uncertainties into the equation, and that we could see a further widening of the term premium. This would have different impacts to various tenors along the yield curve. We can manage this by targeting our exposure along various bond maturities that we believe have the most beneficial capital gain potential across a range of outcomes.
Despite all the many pressures influencing the yield curve, we are constructive of today’s more normalized yield environment. Clients can once again earn a reasonable mid-single digit return from their fixed income allocations, while providing a source of liquidity and stability should the outlook turn out worse than what is priced in.