

Trade war uncertainty sent global stock markets on a wild ride in the second quarter. The S&P 500 approached bear market territory in early April before staging the sharpest recovery on record as investors rapidly discounted the impact of tariffs on the global economy.
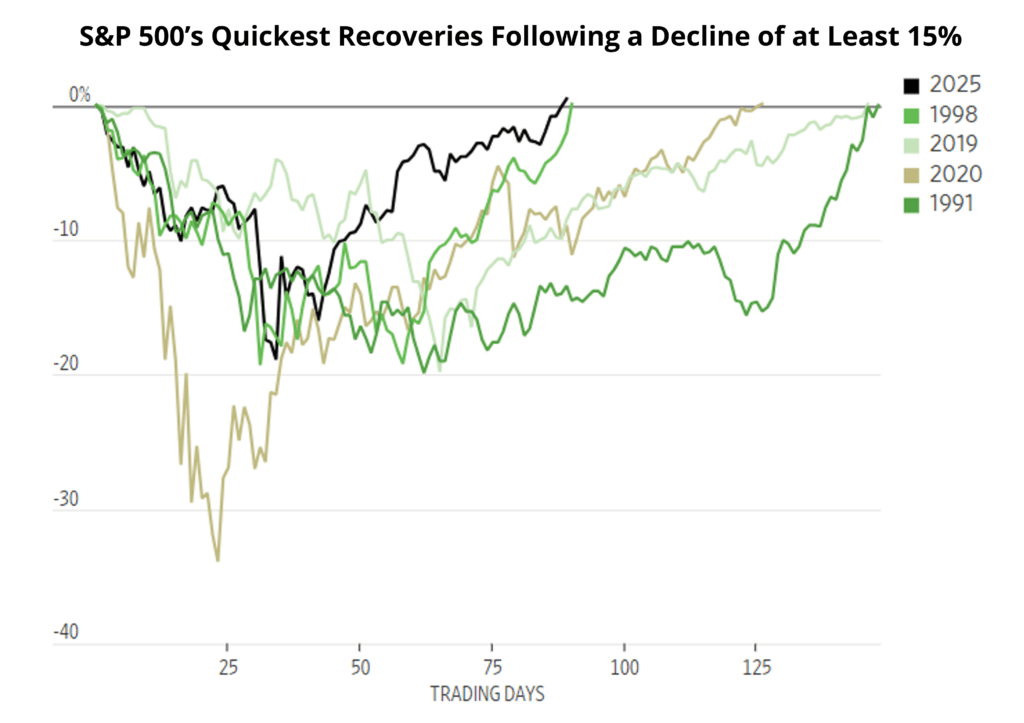
Source: Dow Jones Market Data, WSJ
QV’s strategies performed as expected into the turbulence of early April, protecting investors’ capital and declining significantly less than the S&P 500 or the Nasdaq Composite.
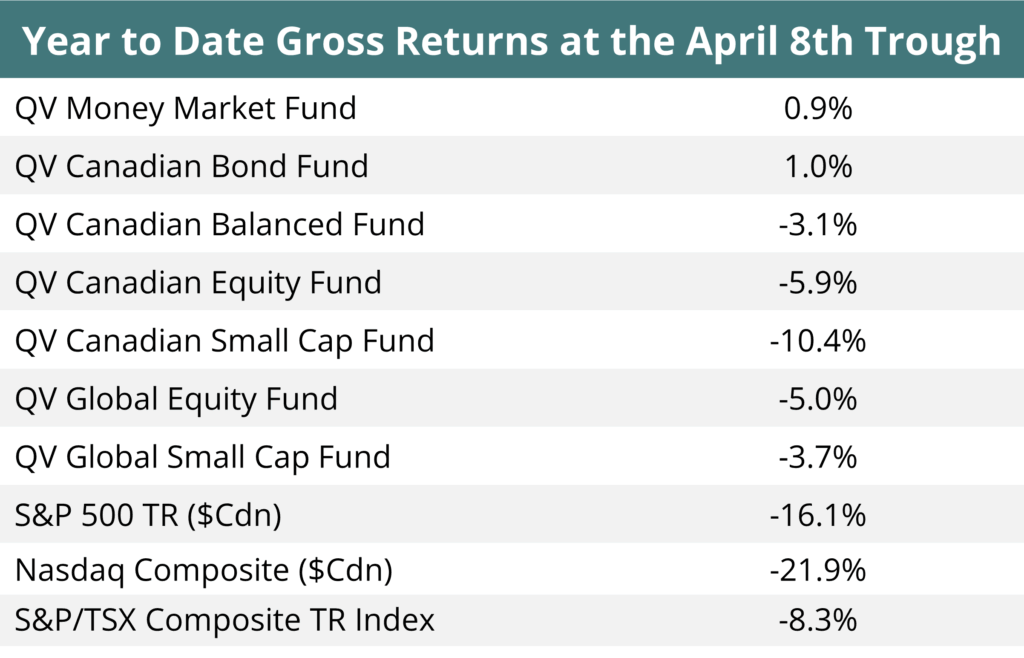
Source: QV Investors
Despite lagging in the ensuing risk-on rally in the latter half of the second quarter, our major strategies’ returns ended the first half of the year near benchmark returns, albeit with a much smoother ride along the way.
Despite the exuberance over the recent market rally, the US market has risen just 6.2% year to date in USD. From the prior market peak in late 2021, it has done better, returning 8.9% percent on an annualized basis. However, to achieve these returns, investors have now had to endure two ~20% or greater drawdowns in the last four years. This highlights a theme discussed in prior QV letters: high starting valuations typically lead to lower returns with excess volatility.
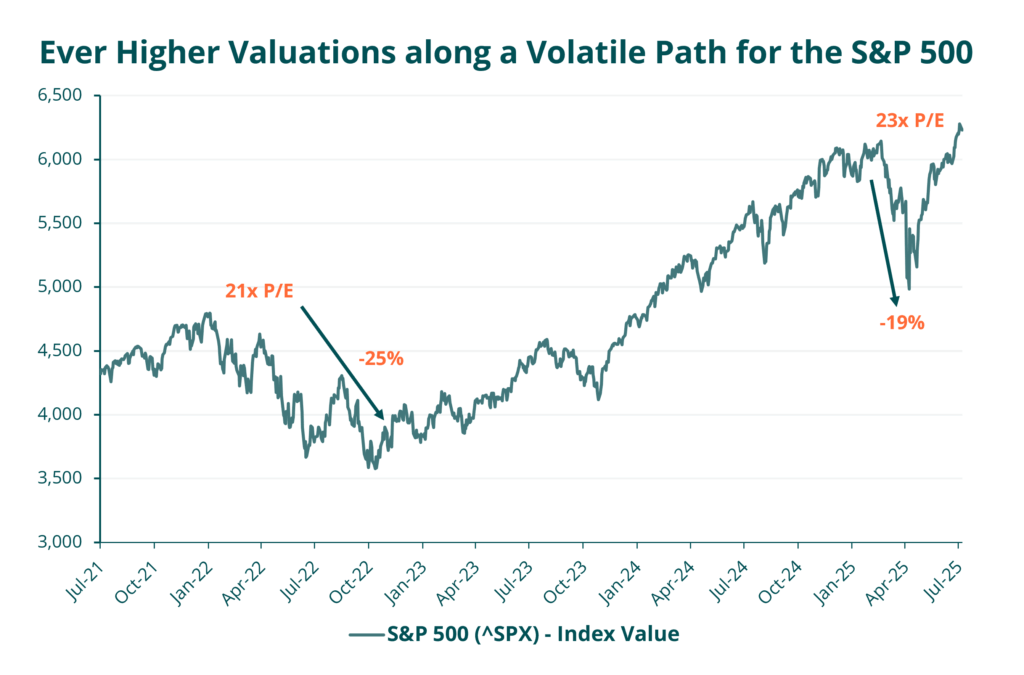
Source: Capital IQ & QV Investors
While the US market has indeed risen to new highs in 2025, returns since 2021 have been dependent on the market multiple remaining at historically extreme levels – currently 23x price to earnings (P/E). Unless investors expect these levels to persist indefinitely, lower future returns remain a high probability in the medium term. On this note, it’s worth mentioning that as a general rule, ~20% or greater market declines such as the tariff induced shock in April tend to occur every few years and generally offer reasonably attractive opportunities to buy stocks. While we were able to selectively deploy additional capital during April, the most pronounced declines occurred in the most expensive and arguably speculative areas of the market and given the high starting valuation, the S&P 500’s decline in April only lowered the market P/E multiple to 19x, near the 10-year median of 18.4x. In other words, the market’s valuation level remained far above typical garden variety bear market troughs which provide broad based opportunity. For example, in the 2022 bear market, the S&P 500’s P/E multiple bottomed at 15.7x. If the April 2025 sell-off had reached a similar valuation, the S&P 500 would have had to decline an additional 17% below its close on the April 8th bottom.
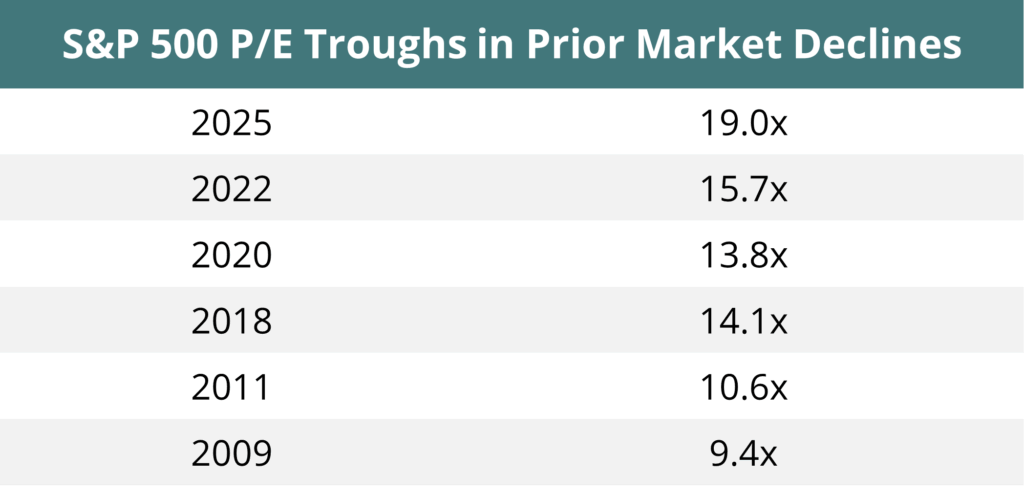
Source: Capital IQ & QV Investors
Beyond US markets, European (+16.7%) Canadian (+10.2%), and Hong Kong (15.4%) equities are performing better on a year-to-date basis in Canadian dollars and from much lower starting valuations. From a non-US investor’s perspective, outperformance has been amplified by pressure on the US dollar in response to ongoing fiscal profligacy and policy uncertainty south of the border. Historically, periods of sustained Canadian and international equity outperformance have accompanied US dollar bear markets. In the first half of 2025, the US dollar fell 10.8%, its weakest start to the year since 1973. While recent price movements shouldn’t be extrapolated, especially in the short-term after such a severe move, factors including geographic equity valuation differentials, structurally rising Japanese interest rates, and a renaissance in European fiscal spending suggest that recent non-US equity relative performance may persist in the medium term, highlighting the importance of diversification and avoiding the most expensive areas of the US market environment despite the continued excitement it elicits from investors.
Strength and its Undoing
History and literature offer many lessons where overconfidence in strength leads to its downfall. Macbeth’s unchecked ambition spurred a descent into tyranny and madness; Samson’s hubris led to losing the source of his strength; Napoleon’s arrogance from past military successes led to a disastrous invasion of Russia when faced with the supply chain challenges of the country’s vast and frigid terrain. Financial history holds similar lessons. In commerce, time and the dynamism of capitalism often prove to be unravelling pinions of prior strengths, displacing competitive advantage and market positions. Sometimes good initial ideas are extrapolated too far; other times, the perception of strength is just a function of circumstance where changing conditions reveal that the perception of a great structure was built on weak foundations.
In the early 2000’s, leading US pharmacy Walgreen’s growth strategy was considered unassailable: cluster stores to drive greater convenience and more visits, offer additional services and multiply profit per customer. As retail sales moved online in the digital age however, and volume migrated from its sprawling physical store footprint, Walgreen’s prior strength became an onerous liability.
The theme extends to macroeconomic forces as well. From its 1999 formation until 2007, the Euro and the European Single Monetary Union were regarded as a major cause of stable GDP growth and low inflation throughout the Eurozone. By 2008, however, it became clear that these institutions had instead precipitated a credit bubble by making debt too available at an unnaturally low interest rate for periphery countries while limiting their ability to inflate it away with currency depreciation. A financial crisis ensued as did a debt overhang that lasted for well over a decade. More recently, COVID and the fragmentation of the existing world order exposed the fragility of offshoring global supply chains which had for decades been considered a sustainable source of comparative advantage and GDP growth. In all cases, it was only in retrospect that the guise of strength was widely recognized to be the handmaiden of future fragility.
At 23x P/E, US stocks appear to be priced for resilient GDP growth, manageable tariffs impacts, the Federal Reserve to lower interest rates in 2025, and inflation to remain contained. Besides the obvious implied above, where could fragility be building up behind this perception of strength?
Consumption is the cornerstone of the economy and has remained unusually resilient despite signals that North American economies are in a very late stage of expansion. Using Visa’s US payments volume as a proxy for consumption, volumes rose a healthy 8% in April. Below the surface however, the pressure on consumers continues to steadily seep up the income curve. McDonald’s US revenue, which is a good barometer of millions of Americans low value everyday purchasing habits, declined by 3.6% in Q1, the worst in over a decade excluding the COVID lockdowns. The company’s management indicated that industry-wide weakness has broadened with both low-income as well as middle-income customer traffic falling nearly double digits while its higher income demographic was flattish. More than ever before it appears, US consumption has become dependent on the wealthiest 10% of earners who now account for a record 50% of consumption, and who also happen to own 87% of US stocks.
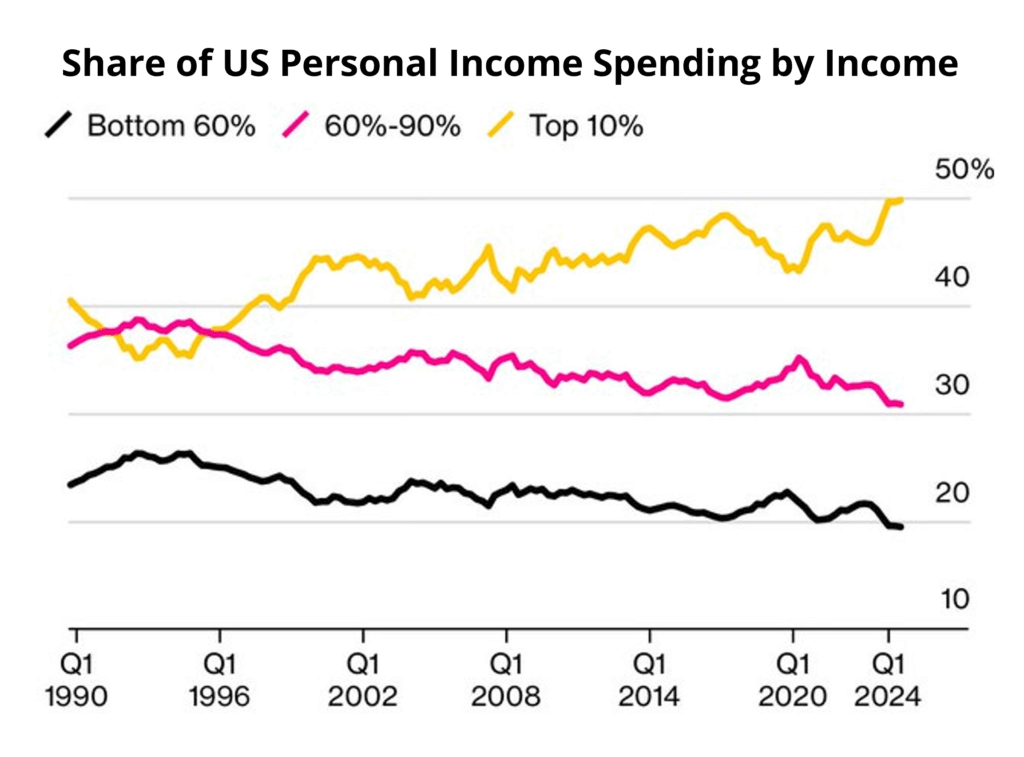
Source: Moody’s Analytics
High asset prices work to sustain wealthy consumers’ confidence and consumption, in effect creating a symbiotic feedback loop with high stock prices which are supported by the expectation of resilient economic growth. Today, perhaps more than ever, high stock prices appear to be supporting the economy while expectations for the economy are supporting stock prices. Such reflexive processes are virtuous until they aren’t. Factor in rampant trading on margin, short-term speculation through option trading, and a pervasive buy-the-dip mentality and the strength of the current market structure and economy may offer the perfect disguise for future fragility masquerading as strength today.
While the hard (and lagging) economic data continue to support a case for economic resilience, many indicators point to fundamental decay. For example, while the low US unemployment rate continues to suggest that the economy is on firm ground, leading indicators such as the difference between ‘jobs are plentiful’ and ‘jobs are hard to get’ from Conference Board Survey data suggest end of cycle deterioration.
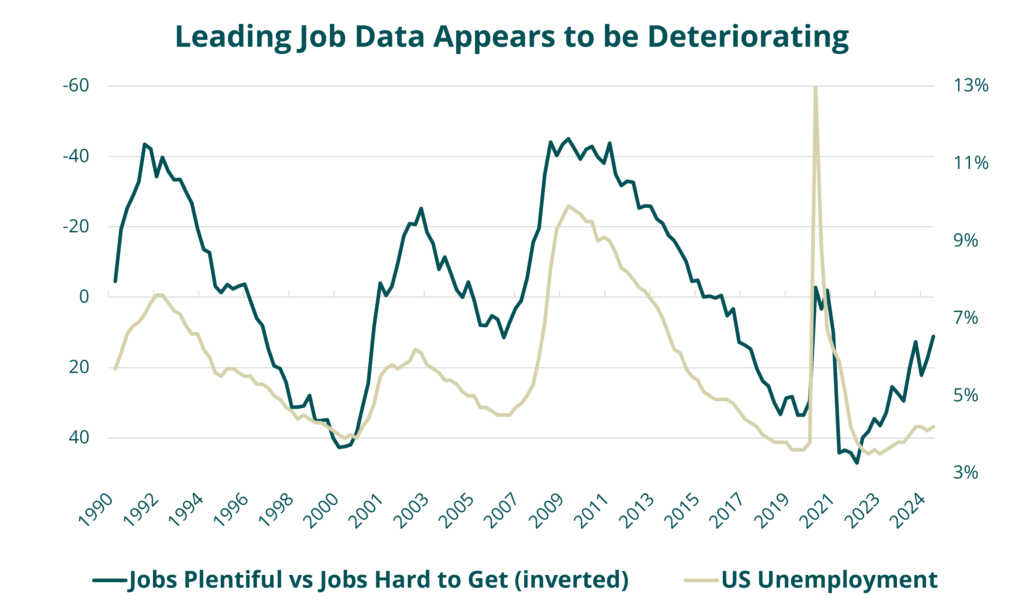
Source: Bloomberg, The Conference Board
Such risks take time to develop however and generally do little to affect stock prices in the short-term. Conversely, there is a possibility that the kindling is in place to fuel a violent, if temporary, melt-up in equities. Developments in AI continue to drive rapid growth and enthusiasm from investors; the passage of Trump’s One Big Beautiful Bill will extend the US deficit to an eye watering ~7% of US GDP, stoking animal spirits in the short-term despite the long-term consequences; impending US bank deregulation is likely to reduce capital level requirements and increase lending capacity; and the Fed may soon make the mistake of lowering rates while the economy is running above long-term potential and asset prices are at all-time highs.
Contrast this with the fact that US equities are priced to offer minimal risk premium to risk-free Treasury bonds, making them unusually sensitive to exogenous shocks. Taken together, the probability for volatility remains high. Given a low margin of safety in the market, investors should seek to maintain one within their own investments and be careful in using the barometer of near-term market returns as a proxy for reasonable risk-adjusted outcomes over time.